Rational approximation of tabulated data using quadratic programming.
Description
This routine uses Quadratic Programming to compute a multivariate rational approximation $f:\mathbb{R}^n\rightarrow\mathbb{R}^{n_1\times n_2}$ of a set of samples $\left\{y_k\in\mathbb{R}^{n_1\times n_2}, k\in [1, N]\right\}$ obtained for different values $\left\{x_k\in\mathbb{R}^n,k \in [1, N]\right\}$ of some explanatory variables $x$. The maximum degree of the rational function and the maximum admissible approximation error are set by the user. A full rational expression is obtained, which ensures that the maximum local absolute error between $\left\{f(x_k), k\in [1, N]\right\}$ and $\left\{y_k, k\in [1, N]\right\}$ remains below the given threshold for each entry (see errapprox for a precise definition). Unless specified, its nonsingularity is guaranteed on the whole considered domain (defined as the convex hull of $\left\{x_k\in\mathbb{R}^n,k \in [1, N]\right\}$).
Syntax
[fdata,fdesc,fsym,flfr]=qpapprox(X,Y,names,maxdeg,maxerr{,options})
Input arguments
The first five input arguments are mandatory:
X | Values $\left\{x_k\in\mathbb{R}^n,k \in [1, N]\right\}$ of the explanatory variables $x$ ($n\times N$ array, where X(:,k) corresponds to $x_k$). |
Y | Samples $\left\{y_k\in\mathbb{R}^{n_1\times n_2}, k\in [1, N]\right\}$ to be approximated ($n_1\times n_2\times N$ array where Y(:,:,k) corresponds to $y_k$ in the general case, or possibly $1\times N$ array where Y(k) corresponds to $y_k$ if $n_1=n_2=1$). |
names | Names of the explanatory variables $x$ ($1\times n$ cell array of strings). |
maxdeg | Maximum degree of the approximating rational function $f$. |
maxerr | Maximum admissible approximation error (if possible): the local absolute error abs(Y(i1,i2,k)-fdata(i1,i2,k)) remains below maxerr for each sample $k\in [1,N]$ and for each entry $i_1\in [1,n_1]$ and $i_2\in [1,n_2]$ (positive number or $1\times N$ array). |
The sixth input argument options is an optional structured variable with fields:
maxexp | Maximum exponent of each explanatory variable in the approximating rational function $f$ ($1\times n$ array). The default value is options.maxexp=maxdeg*ones(1,n). |
postest | Inclusion of additional constraints to ensure that the denominator $d$ of $f$ is strictly positive on the whole considered domain (0=no, 1=yes). The default value is options.postest=1 provided the GSS library or the LFR toolbox is available. If the nonsingularity of $d$ still cannot be proved, additional parameters can be tuned (see remark below). |
trace | Trace of execution (0=no, 1=text, 2=text+figures). The default value is options.trace=1. |
viewpoint | This option is applicable only if 3-D graphs are to be displayed (options.trace=2 and $n=2$). It represents the deviation with respect to the default viewpoint (see plotapprox). The default value is options.viewpoint=[0 0]. |
warn | Warnings display (0=no, 1=yes). The default value is options.warn=1. |
Output arguments
fdata | Values $\left\{f(x_k)\in\mathbb{R}^{n_1\times n_2},k \in [1, N]\right\}$ of the approximating function $f$ (same size as Y). |
fdesc | Description of the approximating function $f$ (fdesc{i1,i2}.cnum(j)/cden(j) and fdesc{i1,i2}.enum(j,:)/eden(j,:) contain the coefficient and the exponents of the $j\,$th monomial of the numerator/denominator used to approximate entry $(i_1\times i_2)$ of Y). |
fsym | Symbolic representation of the approximating function $f$ (symbolic object). |
flfr | Linear fractional representation of the approximating function $f$ (GSS object if the GSS library is installed, LFR object otherwise if the LFR toolbox is installed). |
Caution
If some values in X are much larger than 1, they must be scaled or normalized.
Remark
The nonsingularity of the denominator $d$ of $f$ is checked using a $\mu$-analysis based algorithm. More precisely, a recursion is implemented, which divides the considered domain into increasingly smaller subsets until either singularities $\left\{\tilde{x}_k\in\mathbb{R}^n,k \in [1, M]\right\}$ are determined or the nonsingularity of $d$ is proved on the whole domain. If required, a new approximating function $f$ is computing which satisfies the additional constraints $d(\tilde{x}_k)>\epsilon_k$, where the $\epsilon_k$ are some positive thresholds. The whole process is then repeated until either nonsingularity of $d$ can be proved or the maximum number of iterations is reached. In the latter case, the variable options.postest can be defined as a 1x3 array:
options.postest(1)is the depth of the recursive procedure (default=4),options.postest(2)allows to strengthen the constraints on the $\tilde{x}_k$, i.e. $\epsilon_k$ is multipled byoptions.postest(2)(default=1),options.postest(3)is the maximum number of times the aforementioned procedure is applied (default=5).
Example
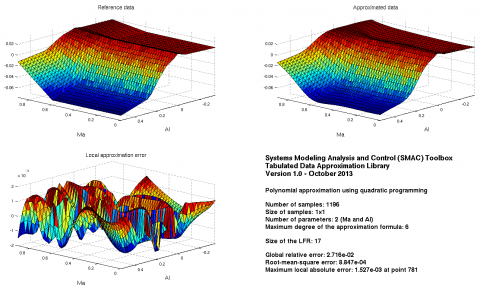
Drag coefficient of a generic fighter aircraft model:load data_cx
Approximation on a rough grid:maxdeg=6;maxerr=0.00153;options.trace=2;options.viewpoint=[-100 0];[fdata1,fdesc1,fsym1,flfr1]=qpapprox(X1,Y1,names,maxdeg,maxerr,options);
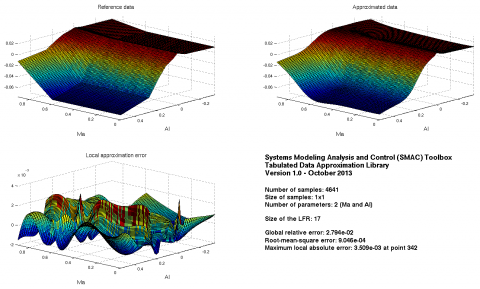
Validation on a fine grid:
plotapprox(Xv,Yv,flfr1,options);
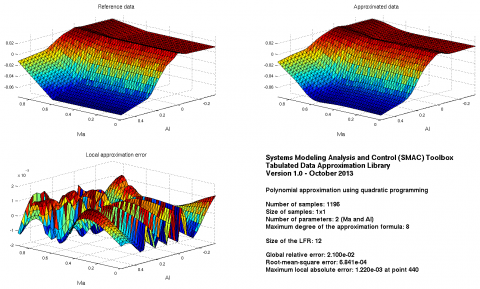
Approximation on a rough grid using a rational function of higher degree and limiting the maximum exponent of each parameter (3 for the Mach number and 6 for the angle of attack):
maxdeg=8;
maxerr=0.00122;
options.maxexp=[3 6]; [fdata2,fdesc2,fsym2,flfr2]=qpapprox(X1,Y1,names,maxdeg,maxerr,options);
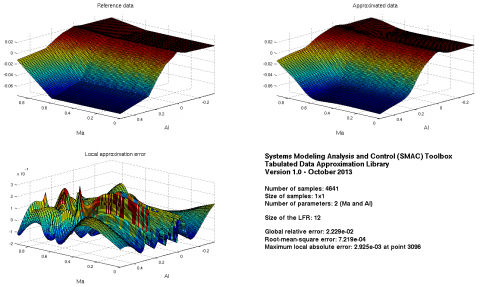
Validation on a fine grid:
plotapprox(Xv,Yv,flfr2,options);
Both the errors and the size of the LFR are quite low!
See also
lsapproxolsapproxtrackerkoalaerrapproxplotapprox
References
| [1] | O.S. Celis, A. Cuyt and B. Verdonk, "Rational approximation of vertical segments", Numerical Algorithms, vol. 45, no. 1-4, pp. 375-388, 2007. |
| [2] | G. Hardier, C. Roos and C. Seren, "Creating sparse rational approximations for linear fractional representations using genetic programming", in Proceedings of the 3rd IFAC International Conference on Intelligent Control and Automation Science, Chengdu, China, September 2013, pp. 232-237. |


