Display a truncated sector.
Description
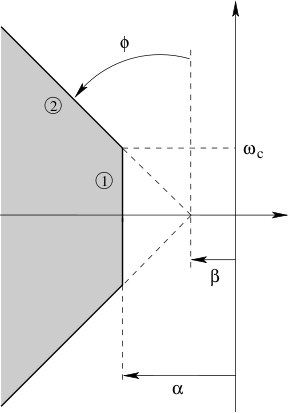
This routine displays a truncated sector in the complex plane. If requested by the user, the eigenvalues of a given LTI system can be displayed too. With reference to the figure below, a truncated sector is defined by three parameters :
- The relative stability degree α is the distance between the vertical axis and segment 1. It is negative if segment 1 is inside the left half plane.
- The angle between the vertical axis and segment 2 is denoted ϕ. It is positive if segment 2 is generated by an anticlockwise rotation of the vertical axis. If β=0, ξ=sin(ϕ) corresponds to the damping factor.
- The imaginary part of the intersection point between segments 1 and 2 is denoted ωc. It is always positive. If omitted, it is automatically computed so that β=0.
Image
Syntax
display_sector(sector{,sys})
Input arguments
sector | Vector [α ξ ωc] characterizing the considered truncated sector. The third parameter ωc is optional. If omitted, its value is automatically computed so that β=0. |
sys | LTI object or square matrix whose eigenvalues are to be plotted. A list of eigenvalues can also be directly given. This argument is optional and the default value is sys=[]. |
Example
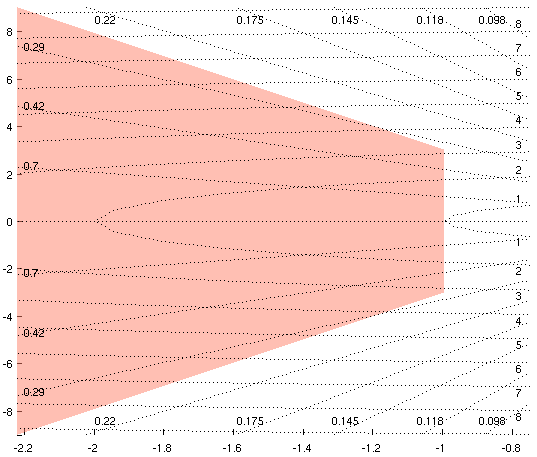
sector=[-1 0.2 3]; display_sector(sector);
Image