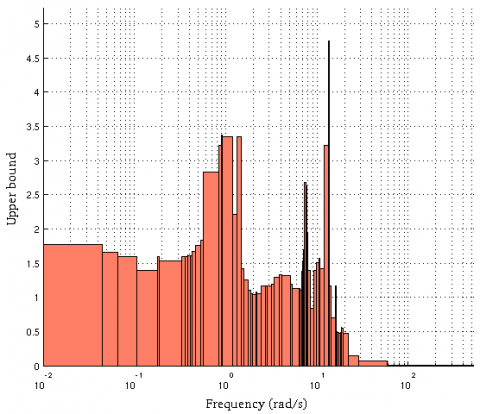
Plot a (skew-)$\mu$ upper bound on frequency intervals.
Description
This routine plots a (skew-)$\mu$ upper bound on a set of $m$ frequency intervals. A stairstep graph is thus obtained.
Syntax
plot_muub(tab{,type})
plot_muub(tab{,wmax})
plot_muub(tab{,type,wmax})
Input arguments
| tab | This argument is typically generated using muub_mixed. It is a structured variable with fields:
|
| type | X-axis type ('lin' $\Leftrightarrow$ linear or 'log' $\Leftrightarrow$ logarithmic). This argument is optional and the default value is type='lin'. |
| wmax | X-axis upper limit. This argument is optional and the default value is wmax=max(max(tab.int)). |
Example
load flexible_airplane
options.elim=0;
[ubnd,wc,tab]=muub_mixed(sys,blk,options);
plot_muub(tab,'log');
